
We host the server and the database, keep the apps working on new versions of iOS and Android and monitor the connection. If the app shows no live data because of something on our side, you pay less for those days.
From SCADA data to an app, a web view and a dashboard.
One data connection to your park feeds every screen. You choose which screens and which parts you want; we build, host and maintain them.
How it works
Connect
We connect to your park’s SCADA through Power Factors (formerly Greenbyte), Bazefield or Darwin. Together with your asset manager we decide which signals are needed.
Design
We design the view in the park’s branding, with its own map or visual. We can also work with your own designer.
Go live
The app goes into the App Store and Google Play. The web view and the dashboard use the same data.
Manage it yourself
You edit texts, news and notifications in the admin portal, and we help you write them. We keep the connection and the apps running.
One platform under every app
Every app looks different, but they all run on the same platform. We have worked hard on it for years, and we put the experience from every project into it.
Stable
The data connection, the storage and the parts of the app are in use at 16 parks. What works well there is the basis for your app.
Fast
Live values refresh every 10 seconds, on every screen at once.
Always improving
What we learn or build at one park goes into the platform. That is how a part such as the status per turbine becomes available to other parks too.
Extendable
If you want a module or a screen added later, we build it on what is already there. You do not start again.
Three screens, one source
All screens read the same data, so they always show the same number.
App
For iOS and Android, free for anyone to download. Part of the content can sit behind a login, for participants or shareholders for example.
Web view
A block with current production and charts that is built into the park’s existing website.
Dashboard
A screen for the office, the park itself or the experience centre, with the map, production and charts side by side. We supply the hardware it needs.
Why a turbine is standing still, per turbine
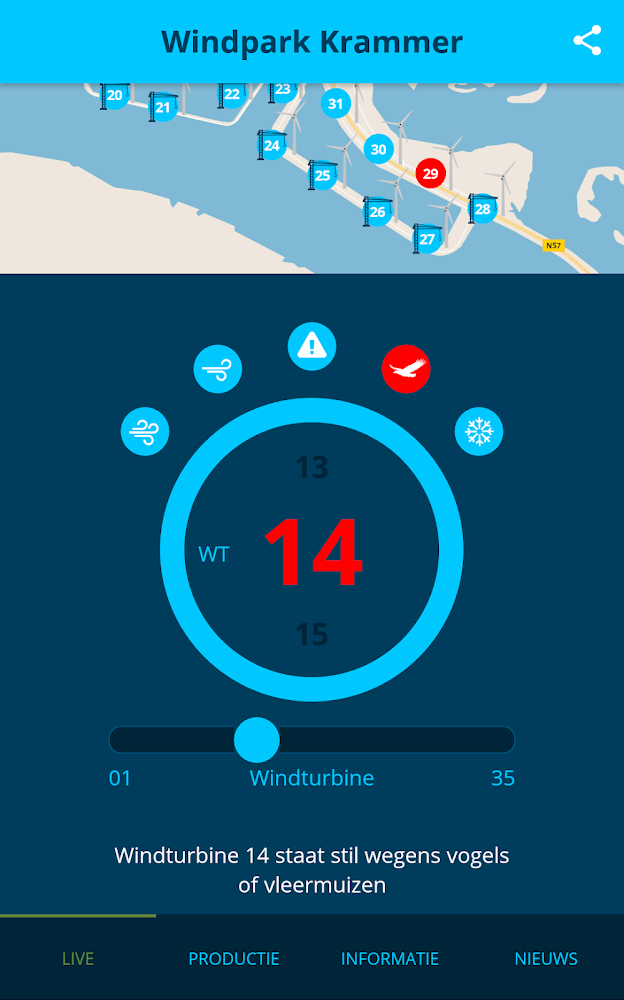
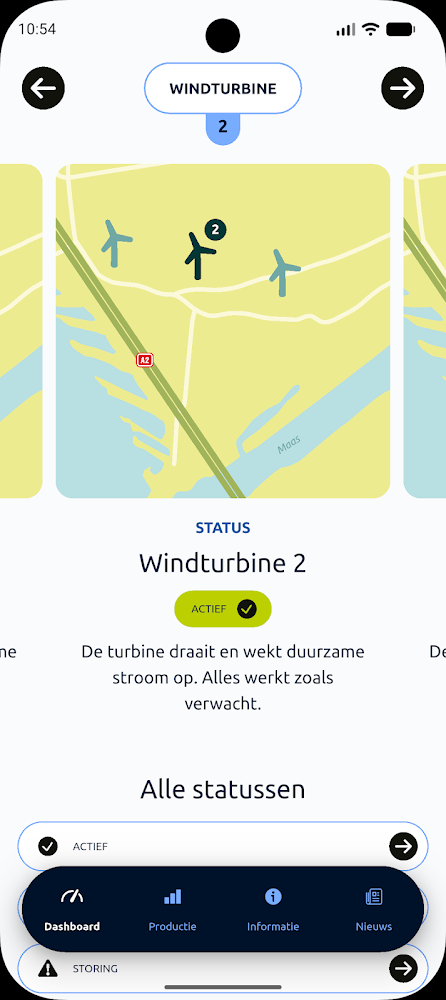
A turbine that is not turning raises questions. The app shows what is going on for each turbine, based on the status codes from the SCADA. Where a code does not match reality, you correct the status yourself in the portal.
- Maintenance and faults
- Icing
- Shadow flicker
- Birds and bats
- Curtailment
- Too much or too little wind
The admin portal
For project managers and communications advisers. You log in at portal.livemegawatt.com and see only the apps of your own park.
- Edit texts and news with text, headings, links, images and video
- Notifications in the app and markers in the charts
- Invite and remove users
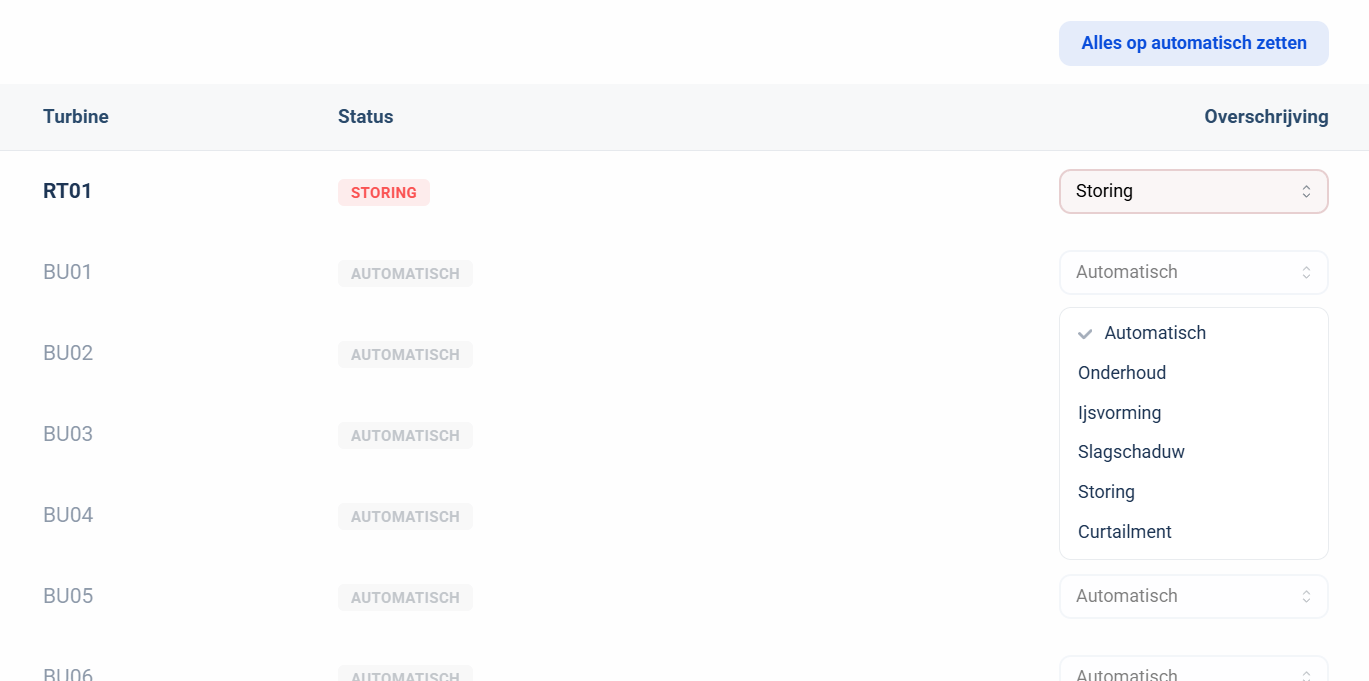
- Override a turbine status by hand
- Enter forecasts per year and per month
- See downloads and daily usage
- A manual in Dutch and English
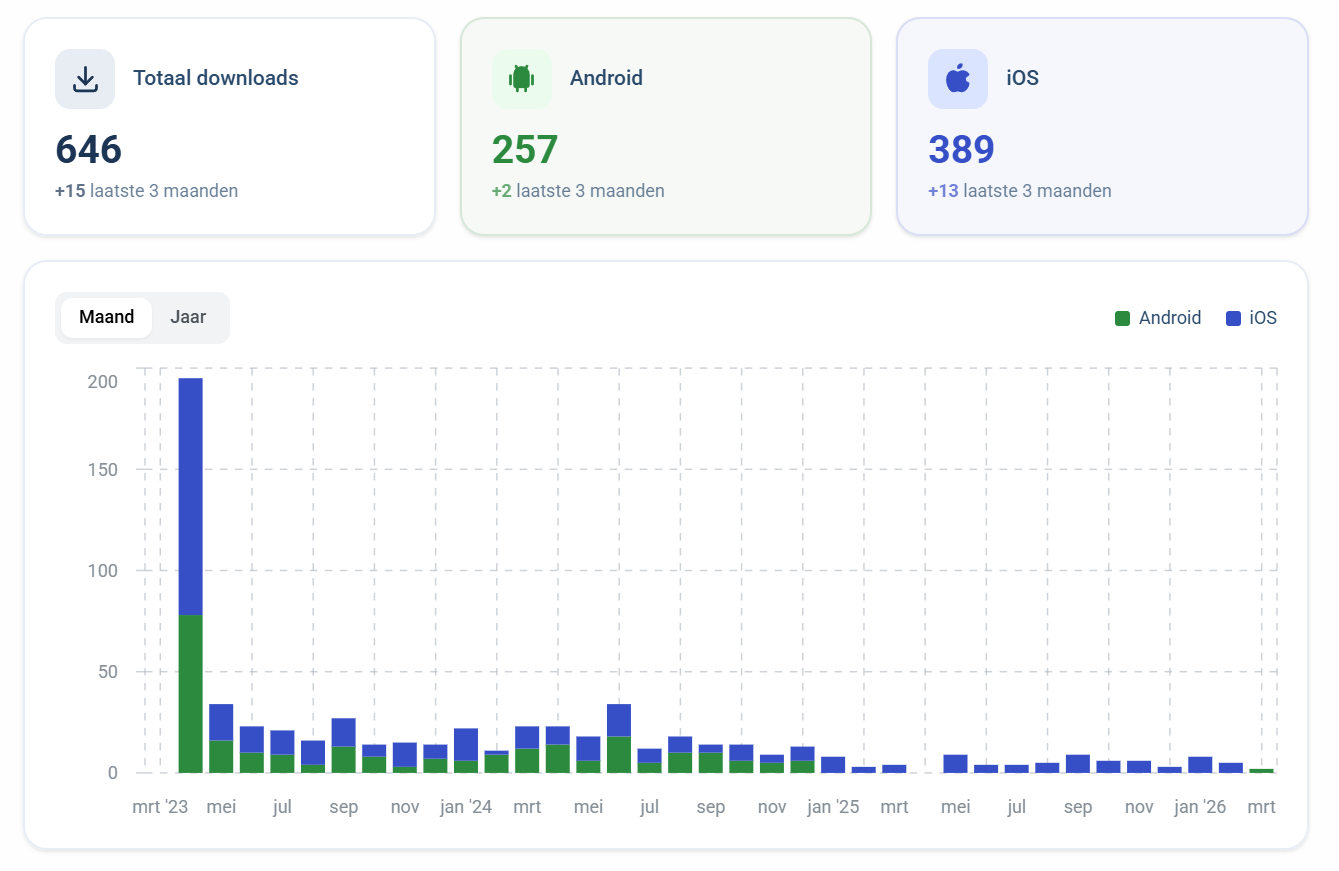
Statistics: is the app being used?
You see how many people have downloaded the app, split between Android and iOS, per month and per year. For apps with a login you also see how many users are active each day. That tells you whether a news item or an open day brings people to the app.
Notifications: tell people before the questions come
Post a notification in the app for planned maintenance or a fault in the data connection. You choose whether it appears as a banner or a dialog, and until when it stays visible. With a marker in the chart you explain why production was lower on a given day.

Packages and modules
Every park starts with the base and adds modules and screens. We quote per park, because the connection and the design differ each time.
Base
Part of every app.- Data connection to the SCADA
- Current production in its own visual
- Wind speed and wind direction
- Key figures: households and CO₂
- An explanation for every figure
- Design in the park’s branding
- App for iOS and Android
- Admin portal
Modules
Choose what suits the park.- Charts with forecast
- Previous periods and yield
- Status per turbine
- Information page
- Weather forecast
- News
- Messages for logged-in users
- Login for participants
Extra screens
The same data in more places.- Web view on the park’s own website
- Dashboard on a screen, with hardware
On request
Built before, not active at any park today.- Push notifications
- Webcam image of the park
- Lock with PIN or fingerprint
- Reactions and likes
Hosting, maintenance and a guarantee on live data
For asset managers: the data connection
What we need from the park and what we do with the data.
- Connections
- Power Factors (formerly Greenbyte and Breeze), Bazefield and Darwin.
- Refresh rate
- Live values every 10 seconds, historical values every minute.
- Read-only
- We read production, wind and status codes. We do not control anything in the park.
- Storage
- Every park has its own database. We store only what the screens need.
- Encryption
- Data can be stored encrypted with AES-256.
- Status codes
- We translate the SCADA codes into understandable reasons for a standstill.