
The app for your energy project. 16 wind farms went before you.
Live Megawatt builds an app of your own for your park and keeps it running afterwards. Local residents and participants see live what the park produces, and why a turbine is standing still.
- apps built and run
- 13
- turbines
- 773
- installed capacity
- 1,960 MW
 Gemini150 turbines600 MW
 Windpark Zeewolde83 turbines320 MW
 SwifterwinT47 turbines262 MW
 Windpark Krammer34 turbines102 MW
 Westermeerwind48 turbines144 MW
 Lake Turkana Wind Power365 turbines310 MW
 Windpark Hanze15 turbines90 MW
 De Groene Delta2 turbines7.2 MW
 Spinderwind4 turbines14.4 MW
 Betuwewind7 turbines27.6 MW
 Windpark Waardpolder6 turbines21.6 MW
 XY Wind9 turbines47.4 MW
 A2 Lage Rooijen3 turbines13.5 MW
Example Wind FarmLive
0 m/s · SW
Current production
0,0 MW
0% of 36 MW
Per turbine11 of 12 turning
123456789101112
- Households now0
- Generated today0 MWh
- CO₂ avoided0 t
History
This year
71.4 GWh
- Best monthFebruary
- Against forecast104%
News
Maintenance on turbine L02 on Thursday
- Open day at the park12 Nov
- First year: more generated than expected3 Nov
- How is the avoided CO₂ calculated?21 Oct
Every app in the park’s own branding
Not a template with a different logo. Each app gets the map, the colours and the key figures of the park itself. Pick a park to read what was different about that project.
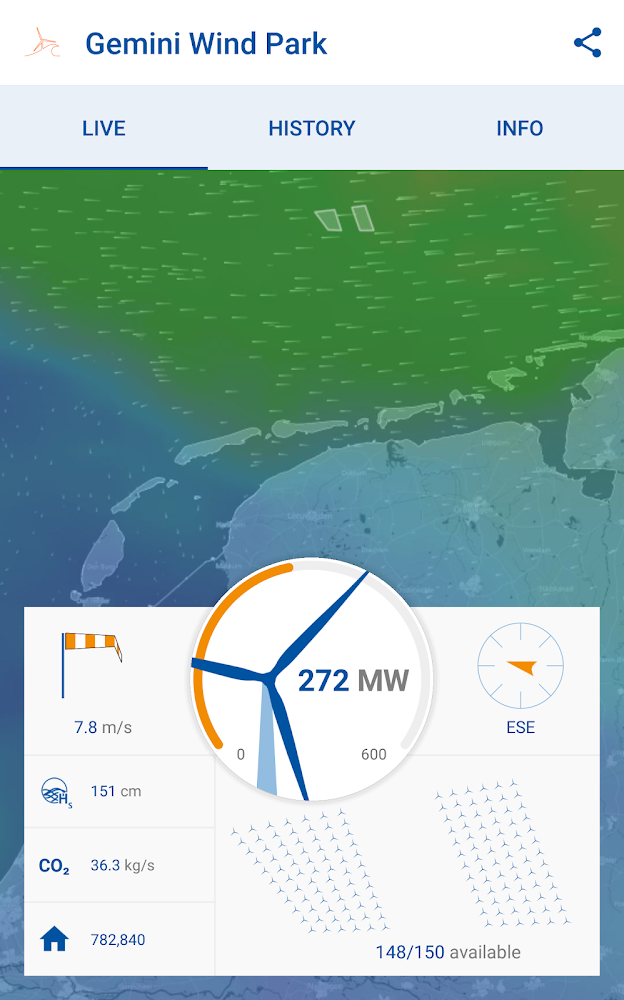
Gemini
150 turbines in the North Sea
The most capacity in the series, far out at sea. The app is in English and shows the park on a map of the North Sea.
Four questions from local residents, answered in the app
A park keeps getting the same questions. The app answers them, so you do not have to each time.
1How much is the park producing right now?
Current output, with the wind speed alongside. Megawatts mean little to most people, so the app converts them to households and avoided CO₂ and explains for every figure how it was calculated.
0,0 MW
- Households right now
- 0
- Generated today
- 0 MWh
- CO₂ avoided today
- 0 t
2Why is that turbine standing still?
The app shows what is going on for each turbine: maintenance, icing, shadow flicker or curtailment. Click a turbine.
3How is the park doing this year?
Charts per day, month and year and since the park started. Per year and in total the forecast sits behind them.
Generated
What households use in the same period
ProductionForecast
4What is happening at the park?
News items, an information page and notifications in the app. Useful during construction and for planned maintenance. You write them in the admin portal, or we connect the app to the news on the park’s website: you then write an item only once and the app links through to the site.
Notice: maintenance on turbine L02 on Thursday
- Open day at the parkNews
- First year: more generated than expectedNews
- How is the avoided CO₂ calculated?Explanation
The same figures on your website and on a screen
The app is the start. The same data connection also feeds a view on the park’s website and a dashboard on a screen: in the office, at the park itself or in the experience centre.
You manage the content
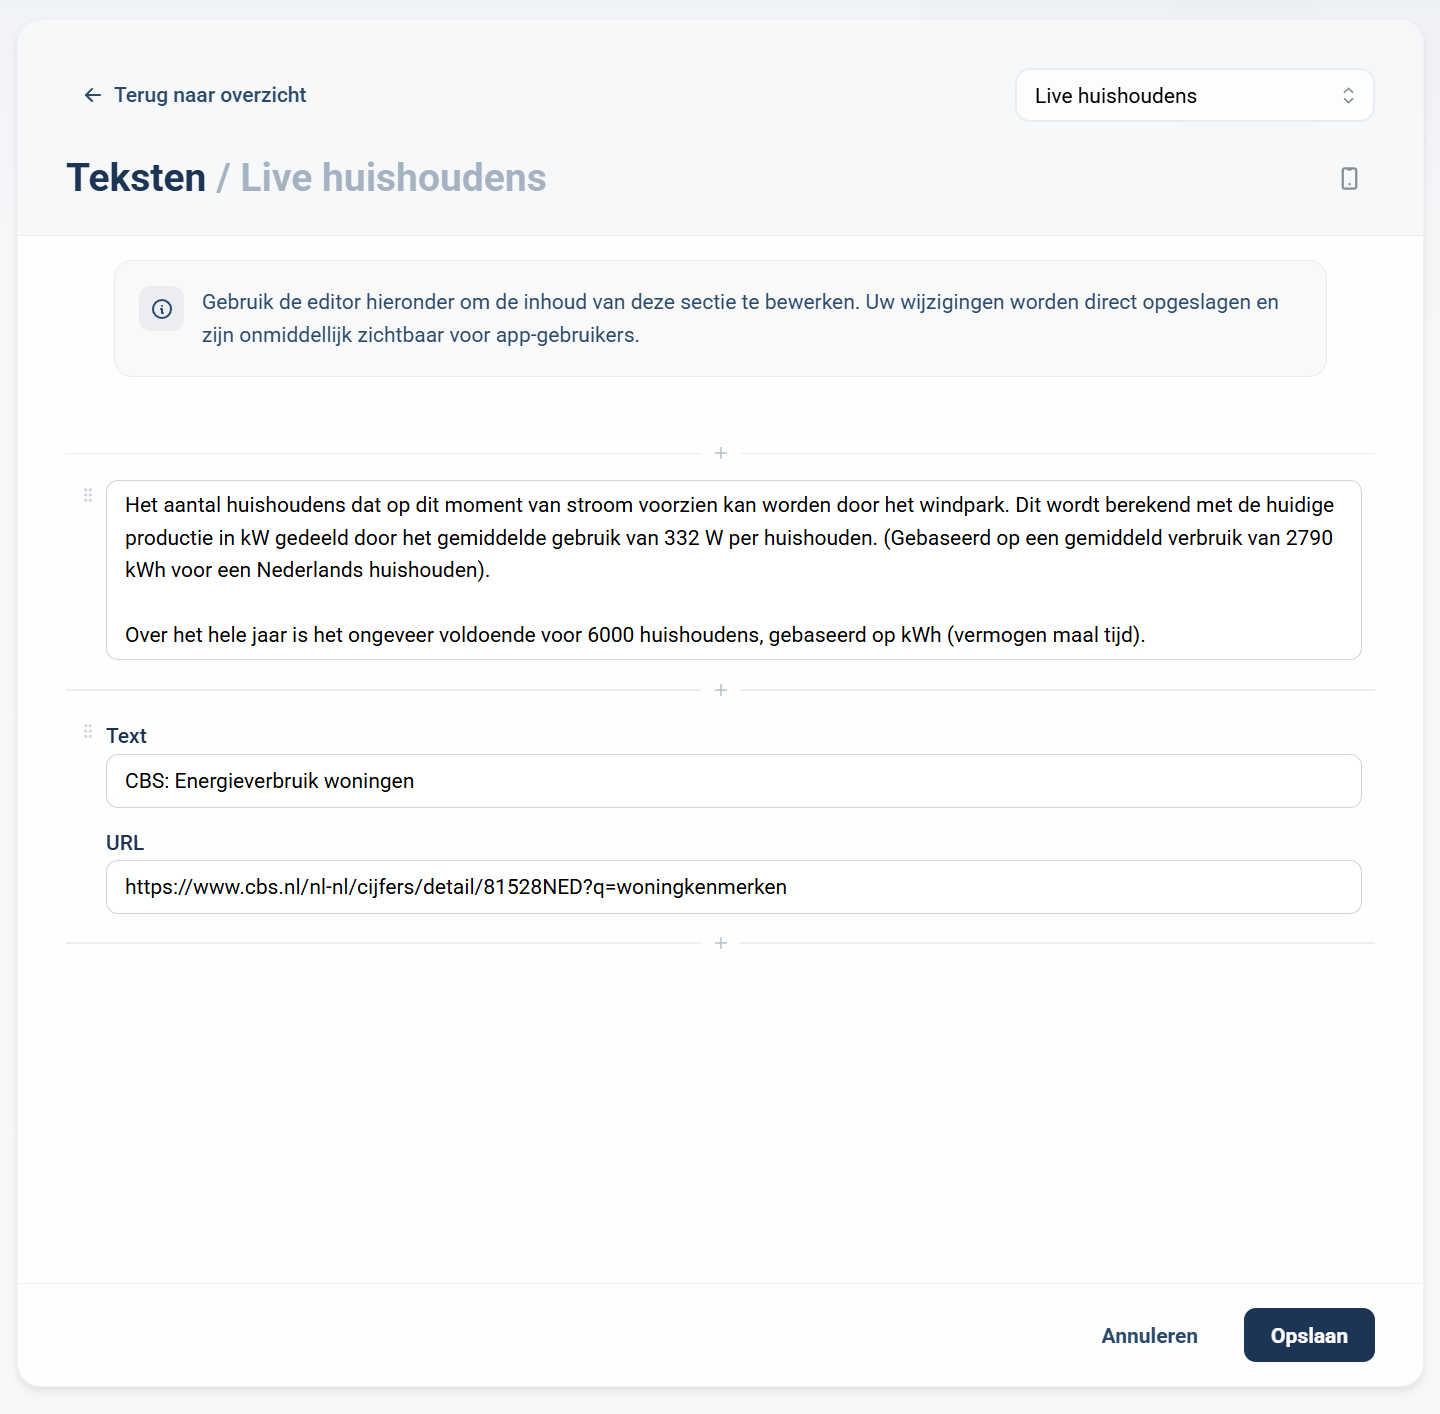
Every app comes with an admin portal. You edit texts and news there yourself, without a new version of the app. We help you write them: after 16 parks we know which texts work and which questions come up.
- Write texts, explanations and news items
- Post notifications in the app, with an end date
- Invite users, including a whole list at once
- Correct the status of a turbine by hand
- See downloads and usage of the app
Running at 16 wind farms
Community wind farms, parks on land and in the IJsselmeer, and parks at sea. At every scale, good communication with local residents matters just as much. So far they are all wind farms; the platform is just as suitable for solar and storage.